In this article, you will learn how to quickly access diagnostics information to identify the root of any potential browser issues. This can be especially useful when communicating with our support engineers or troubleshooting dashboard performance issues.
To access the diagnostics report, simply use the keyboard shortcut ALT + SHIFT + L to see the most current report.
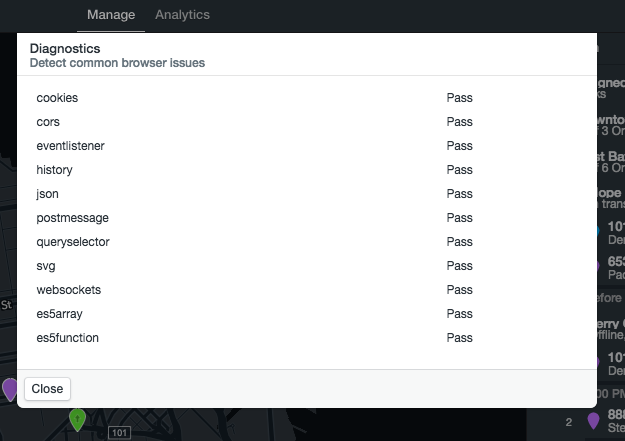
This is an example of a diagnostic report. You can simply screenshot this and send it to our support team when attempting to troubleshoot dashboard issues.